
Shock Load Rating and Dynamic Impact Torque in Micro Planetary Gear Motors: Rotor Inertia Dissipation, Carrier Pin Shear, and ISO 6336 Peak Overload Sizing
Size micro planetary gear motors for shock loads with a rotor inertia example, carrier pin checks, ISO 6336 limits, and a practical checklist. Request a review.
Shock load rating for micro planetary gear motors must cover both running torque and the energy released during a sudden stop. Motor stall torque describes electromagnetic torque at zero speed under specified electrical conditions. It does not include the deceleration reaction from a spinning rotor, gears, coupling, and external load. Before approving a drive for a door lock, valve, gripper, or positioning mechanism, ask for an allowable transient torque, its duration, and the permitted number of events.
Published and content reviewed: November 12, 2026. Scope: Global OEM selection and mechanical integration of 6 mm to 32 mm micro planetary gear motors. This guide provides an analytical screening method and an RFQ framework. It contains no measured impact tests, customer failure statistics, or certified ratings for a commercial motor. All numerical inputs below are hypothetical; they must be replaced with model-specific data before purchase approval.
Selection shortcut: first reduce speed before contact where possible; then assess a compliant stop or torque limiter against the remaining energy. Current limiting can reduce electromagnetic torque, but switching off current does not remove kinetic energy already stored in the mechanism. A stronger carrier alone does not establish that the teeth, shaft, bearings, and housing can withstand the same event.
Request an application review with the collision speed, load inertia, stopping distance or duration, required cycle count, and mounting envelope. An RFQ stating only “must withstand stall” leaves the most important shock conditions undefined.
1. Rotor Inertia Dissipation and Dynamic Impact Torque
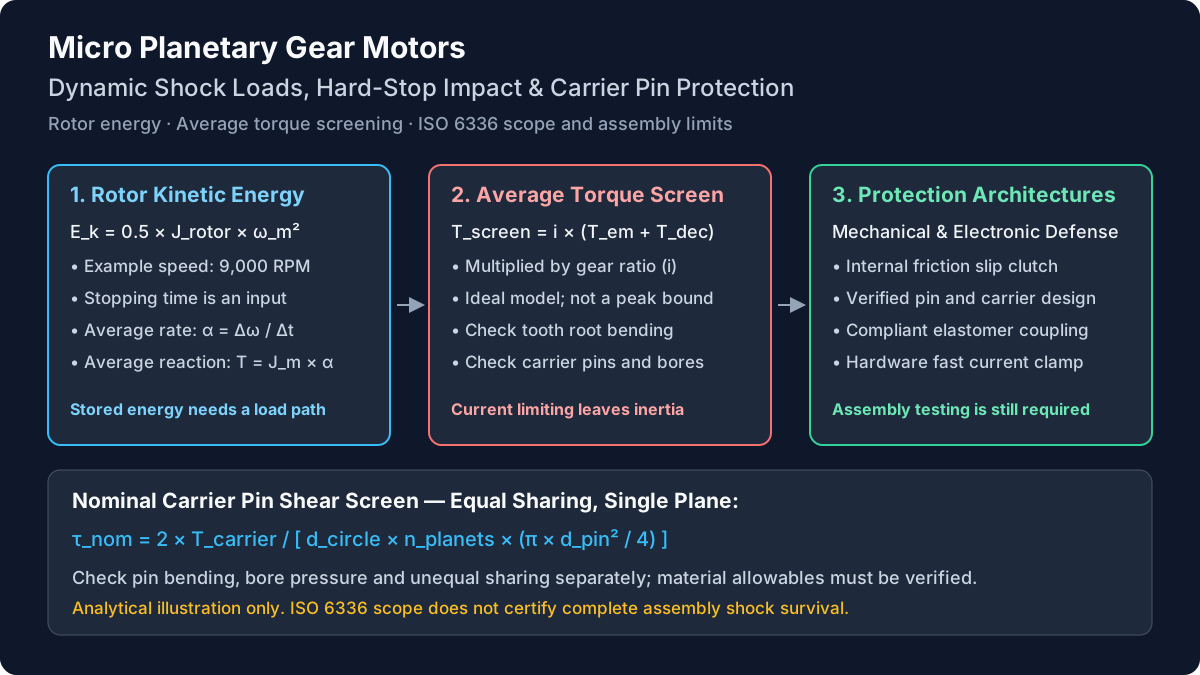
The schematic identifies possible load paths and inspection points. It is conceptual, not a dimensioned planetary gear layout or evidence that a particular component will fail first.
Conceptual diagram: rotor energy reaches the gear train during deceleration, while an output constraint generates a reaction through the assembly. Actual force distribution depends on gear geometry and support stiffness.
For a rotor with inertia J_m in kg·m² and speed ω_m in rad/s, stored energy and average deceleration magnitude are:
ω_m = 2 × π × n_m / 60
E_rotor = 0.5 × J_m × ω_m²
α_avg = ω_m / Δt
T_inertia_avg = J_m × α_avg
These equations assume the rotor stops from its initial speed within Δt. The last equation gives an average inertia reaction over that interval. It does not predict the highest torque in a short pulse. Backlash closure, elastic windup, resonances, and rebound can produce a different peak.
For an ideal rigid reduction with i = motor speed / output speed, neglecting internal losses and gear inertia, an output-equivalent screening torque is:
T_output_screen = i × (T_em_avg + J_m × ω_m / Δt)Here T_em_avg is motor electromagnetic torque during the stop, taken positive when it continues to drive into the obstruction. Active braking changes its sign and time history. A steady-state gearbox efficiency is useful for running torque calculations, but is not a validated attenuation factor for an impact pulse. This guide therefore uses an ideal, lossless transmission for the shock screen. That choice is not a bound on the true instantaneous peak.
Include the external load separately: its energy is 0.5 × J_load × ω_output². Ideal rotor inertia referred to the output is J_m × i²; gear and coupling inertias require their own speed references. Do not add reflected inertia again if it is already included in a system model. A compliant shaft, clutch, or non-backdrivable stage can invalidate a single rigid-body stopping time.
2. Reproducible Engineering Example: An Assumed 16 mm Drive
Consider a hypothetical 16 mm motor and 64:1 planetary gearhead. These values illustrate the method; “16 mm” does not imply these ratings are available from any supplier.
- Motor speed at contact: 9,000 RPM, or 942.48 rad/s.
- Rotor and input coupling inertia: 0.35 g·cm² = 3.5 × 10⁻⁸ kg·m².
- Continuous motor torque: 0.0024 N·m.
- Electromagnetic torque assumed throughout the collision: 0.0120 N·m.
- Reduction ratio: 64:1; assumed running efficiency: 0.73.
- Assumed gearbox continuous rating: 0.150 N·m.
- Assumed gearbox transient rating: 0.350 N·m; event duration and cycle allowance remain to be agreed with a supplier.
- Assumed rotor stopping time: 2.0 ms. External load inertia and gear inertia are omitted from this first screen.
The continuous output available from the motor is approximately 0.0024 × 64 × 0.73 = 0.1121 N·m. This is lower than the assumed gearbox continuous limit of 0.150 N·m. Keep those two limits distinct: the assembled drive is constrained by both.
Rotor energy:
E_rotor = 0.5 × 3.5 × 10⁻⁸ × 942.48² ≈ 0.01554 J

Average motor deceleration:
α_avg = 942.48 / 0.002 = 471,240 rad/s²

Average rotor inertia reaction at the motor:
T_inertia_avg = 3.5 × 10⁻⁸ × 471,240 ≈ 0.01649 N·m

Ideal output-equivalent average screening torque:
T_output_screen = 64 × (0.0120 + 0.01649) ≈ 1.824 N·m
That screen is about 5.21 times the assumed 0.350 N·m transient limit and 12.16 times the gearbox continuous rating. It rejects this combination for approval under these assumptions. It does not predict which part breaks, the exact peak, or the number of impacts to failure.
Even with zero electromagnetic torque, the rotor contribution alone is about 1.056 N·m in this ideal model. This explains why simply disabling the bridge at contact can leave a substantial mechanical demand. Conversely, assuming full stall torque throughout a two-millisecond collision may overstate electrical drive torque: winding inductance, back-EMF, controller limits, and supply impedance determine actual current.
The next decision is to measure speed and stopping behavior, reduce approach speed, add energy absorption, or select a drive with a qualified transient envelope. Use the gear ratio and output torque calculator for the baseline running calculation; it does not certify a shock rating.
3. Carrier Pin Shear and Other Component Checks
An overload review should cover the complete assembly. The following are possible failure mechanisms to investigate, not teardown findings from this article.
Tooth root bending and contact damage
A sudden mesh load can raise tooth root bending stress or damage the contacting flanks. Ask for tooth geometry, material condition, face width, load sharing, and contact pattern. ISO 6336-3:2019 concerns tooth bending calculations within its scope; citing it does not qualify the entire gearbox for collision survival.
Carrier pin shear, bending, and bore deformation
For a carrier torque T_c, planet count n_p, and pin-circle diameter d_c, an equal-sharing tangential pin-load approximation is:
F_pin_nom = 2 × T_c / (d_c × n_p)
A_pin = π × d_pin² / 4
τ_pin_nom = F_pin_nom / A_pin
Use consistent SI units. This is nominal single-plane shear and assumes all pins carry equal tangential force. Real mesh forces, unequal planet loading, pin bending, interference fits, carrier flexibility, and bearing contact need separate checks. Two carrier plates do not automatically produce ideal double shear. A cantilevered pin may be limited by bending or bore pressure before its nominal shear capacity is reached.
For illustration, 0.350 N·m on a 6 mm pin circle with three equally loaded 1 mm pins gives about 38.9 N per pin and 49.5 MPa nominal shear. The 1.824 N·m screen gives roughly 258 MPa using the same geometry. Neither result is a strength approval without material, support, and load-distribution evidence.
Ring gear, output shaft, bearings, and housing
Check ring support and wall geometry, shaft shoulders and flats, bearing static capacity, and housing attachments. An external arm striking an offset stop can add radial and axial loads to torsion. Improving one component may move the limiting failure elsewhere.
4. ISO 6336 Scope and Peak Overload Sizing
Use two separate engineering questions: will the load spectrum meet the required fatigue life, and will the worst defined event cause unacceptable permanent damage? A service or application factor alone cannot answer the second question.
ISO 6336-1:2019 provides a gear-rating framework with stated geometry and manufacturing limits. Its public scope excludes several damage mechanisms and does not establish performance of an assembled drive. Sintered or forged tooth finishes also require attention to its exclusions; do not assume the method applies to every miniature gear manufacturing route.
For repeat impacts, ISO 6336-6:2019 addresses variable-load life for pitting and tooth root bending. It does not provide a carrier pin, shaft, bearing, or housing qualification.
Have the responsible gear designer document applicable methods, material allowables, load factors, and agreed safety margins. This article does not prescribe a universal ISO static safety factor of 1.5 or a permitted percentage overload. Static yielding, case damage, unusual miniature tooth geometry, and assembly contact may need additional analysis and representative testing. A procurement requirement should name the failure modes and acceptance limits as well as the standard edition.
5. Stopping-Time Sensitivity: A Screening Table
The six cases below use the same assumed rotor, speed, ratio, and 0.0120 N·m drive torque. They vary only stopping time. They are calculated scenarios, not measured properties of steel, plastic, or rubber stops. Actual duration depends on the complete mechanism.
| Assumed stopping time | Average deceleration (rad/s²) | Rotor reaction at motor (mN·m) | Ideal output screen (N·m) | Ratio to 0.350 N·m limit | Decision |
|---|---|---|---|---|---|
| 1 ms | 942,478 | 32.99 | 2.879 | 8.23× | Exceeds assumed limit; revise design |
| 2 ms | 471,239 | 16.49 | 1.824 | 5.21× | Exceeds assumed limit; revise design |
| 5 ms | 188,496 | 6.60 | 1.190 | 3.40× | Exceeds assumed limit; revise design |
| 10 ms | 94,248 | 3.30 | 0.979 | 2.80× | Exceeds assumed limit; revise design |
| 25 ms | 37,699 | 1.32 | 0.852 | 2.44× | Exceeds assumed limit; revise design |
| 50 ms | 18,850 | 0.66 | 0.810 | 2.31× | Exceeds assumed limit; revise design |
Longer stopping time reduces the inertia contribution. It cannot remove torque that the motor continues to apply: in this lossless screen the electrical term alone is 64 × 0.012 = 0.768 N·m, already above the assumed transient limit. A bumper therefore needs a coordinated current or motion strategy, or a different drive rating.
If speed at contact is halved with inertia unchanged, stored rotor energy falls to one quarter. If stopping duration is unchanged, its average inertia torque halves. These are different scaling laws; do not treat an energy reduction percentage as the same reduction in instantaneous peak stress. A measured torque trace remains necessary for final qualification.
6. Shock Mitigation Architectures
Select mitigation by where energy can go and what happens after a jam. The options below do not carry universal response times, packaging increments, or cost multipliers; those depend on the actual implementation.
| Architecture | Main effect | What must be verified | Important limitation |
|---|---|---|---|
| Friction slip clutch | Limits transmitted torque while dissipating sliding energy as heat | Breakaway band, dynamic slip torque, wear, temperature, and energy per event | Torque can overshoot; location determines which stages remain loaded |
| Elastomeric bumper or coupling | Adds travel and compliance; damping dissipates some energy | Available deflection, stiffness, damping, rebound, and aging | A spring stores energy and may return it; compliance alone is not dissipation |
| Controlled approach deceleration | Reduces speed and energy before contact | Sensor position, stopping distance, fault response, and brake-energy path | An unexpected obstruction can occur before the planned stop |
| Hardware current limit | Restricts electromagnetic torque | Actual threshold, blanking, winding-current decay, and driver behavior | Does not directly remove stored mechanical inertia |
| Firmware torque or current limit | Coordinates motion and fault handling | Sample rate, filtering, execution delay, and measured system response | Timing varies; current is not a complete impact-torque measurement |
| Sacrificial replaceable element | Provides a designed overload release | Release threshold, debris containment, service access, and safe recovery | A destructive release requires replacement and application approval |
Slip clutch selection
Place the clutch so that the intended vulnerable components are protected. An output clutch and an input clutch expose different internal stages to rotor and load energy. Require enough torque for normal startup and process load, while keeping the worst measured transmitted torque below the agreed assembly limit. Check static breakaway, dynamic friction, overshoot, wear, and hot or cold behavior independently.
Energy capacity matters as much as setting torque. Estimate energy per event, event frequency, and cooling time; then verify the clutch at those conditions. A torque setting below a catalog peak does not imply unlimited repeated slip or unlimited gearbox life. Loss of position during slip may also require rehoming.
Current limiting and active braking
There is no universal 10–50 ms firmware delay or sub-millisecond guarantee for a hardware limiter. A driver may have fast regulation, slower fault logic, and configurable filtering at the same time. Measure the actual current and mechanical response. Determine whether shutdown coasts, shorts the windings, or regenerates energy into the supply; those states produce different braking behavior.
Use current limiting to control the electrical contribution and a defined motion or mechanical strategy for the stored energy. Ask for synchronized speed, current, and torque measurements rather than accepting a current-limit value as a shock-load certificate.
7. Planet Carrier Materials and Support Geometry
Material names alone cannot establish carrier pin strength. Heat treatment, core toughness, case depth, surface finish, fit, and geometry matter. This table identifies evidence to request instead of assigning unsupported shear strengths or claiming one alloy always survives an impact.
| Candidate construction | Potential selection reason | Evidence to request | Boundary to resolve |
|---|---|---|---|
| Through-hardened bearing-steel pin | Hard wear surface for a compact bearing interface | Actual grade, heat treatment, hardness, finish, and toughness basis | Hardness does not establish impact ductility |
| Case-hardened alloy-steel pin | Wear-resistant surface with a different core condition | Case depth, core properties, distortion control, and inspection | A small pin may not retain the assumed tough core |
| Stainless pin and carrier | Corrosion compatibility | Exact grades, heat treatment, corrosion environment, and fatigue data | Stainless alone does not prove sterilization compatibility |
| Powder-metal carrier | Repeatable geometry at production volume | Density, porosity, local properties, and bore-retention tests | Bulk handbook strength may not represent the critical section |
| Brass carrier with steel pins | Machining and assembly flexibility | Brass grade, pin retention, bore pressure, and deformation limits | Carrier bore deformation may govern before pin shear |
| Polymer carrier with metal pins | Low mass or acoustic requirements | Creep, temperature, moisture, retention, and repeated-load data | Compliance and aging can change alignment and backlash |
For a simplified end-loaded cantilever pin, deflection is F × L³ / (3 × E × I), with circular section inertia I = π × d⁴ / 64. This shows why unsupported span and pin diameter strongly influence alignment. A real planet gear distributes force along the pin and adds bearing contact effects, so the simple beam expression is a screening aid.
Dual-plate support can improve stiffness, but the benefit depends on both plates, fit, clearance, and load position. There is no universal fourfold reduction or ratio threshold that makes it mandatory. Request the support drawing and compare deflection, contact pattern, and retention under the defined transient. See the POM plastic versus MIM metal gear comparison for manufacturing trade-offs that also require model-specific validation.
8. Packaging and Mechanical Integration
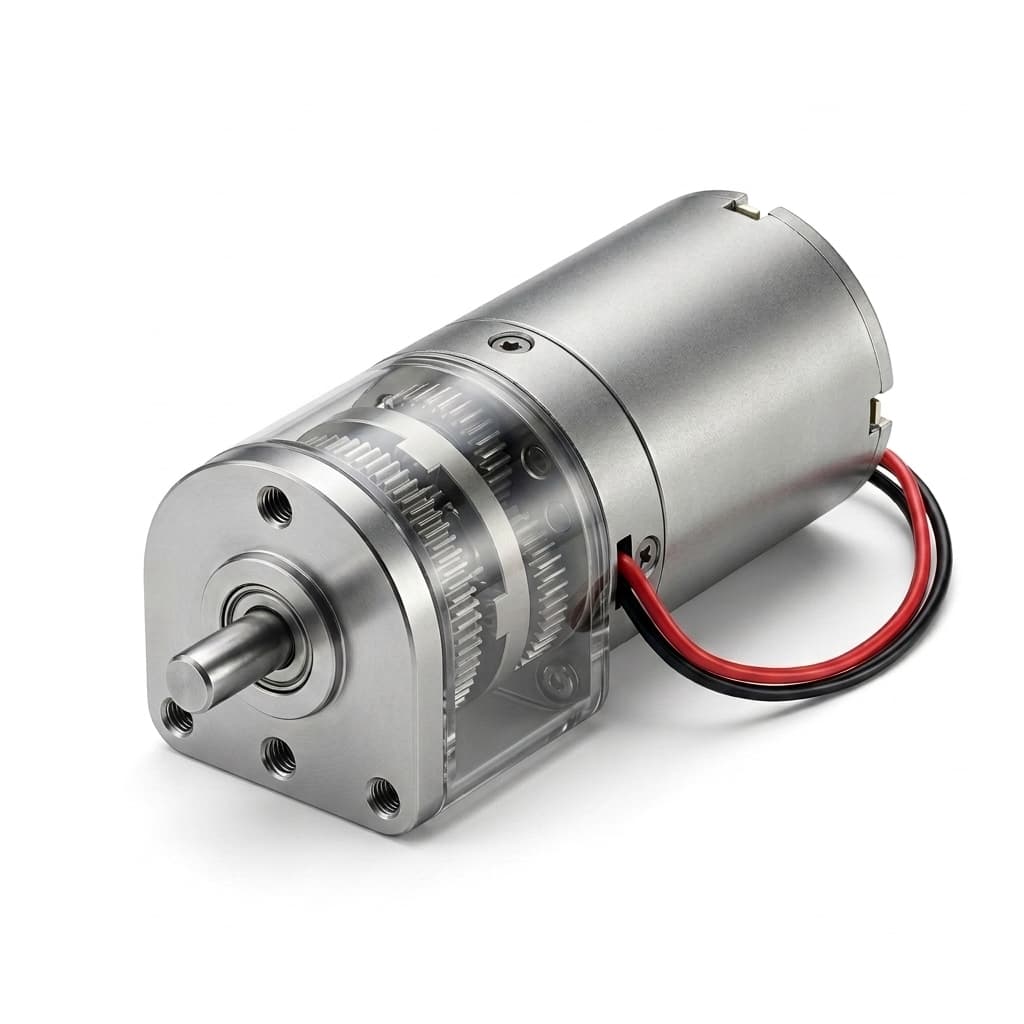
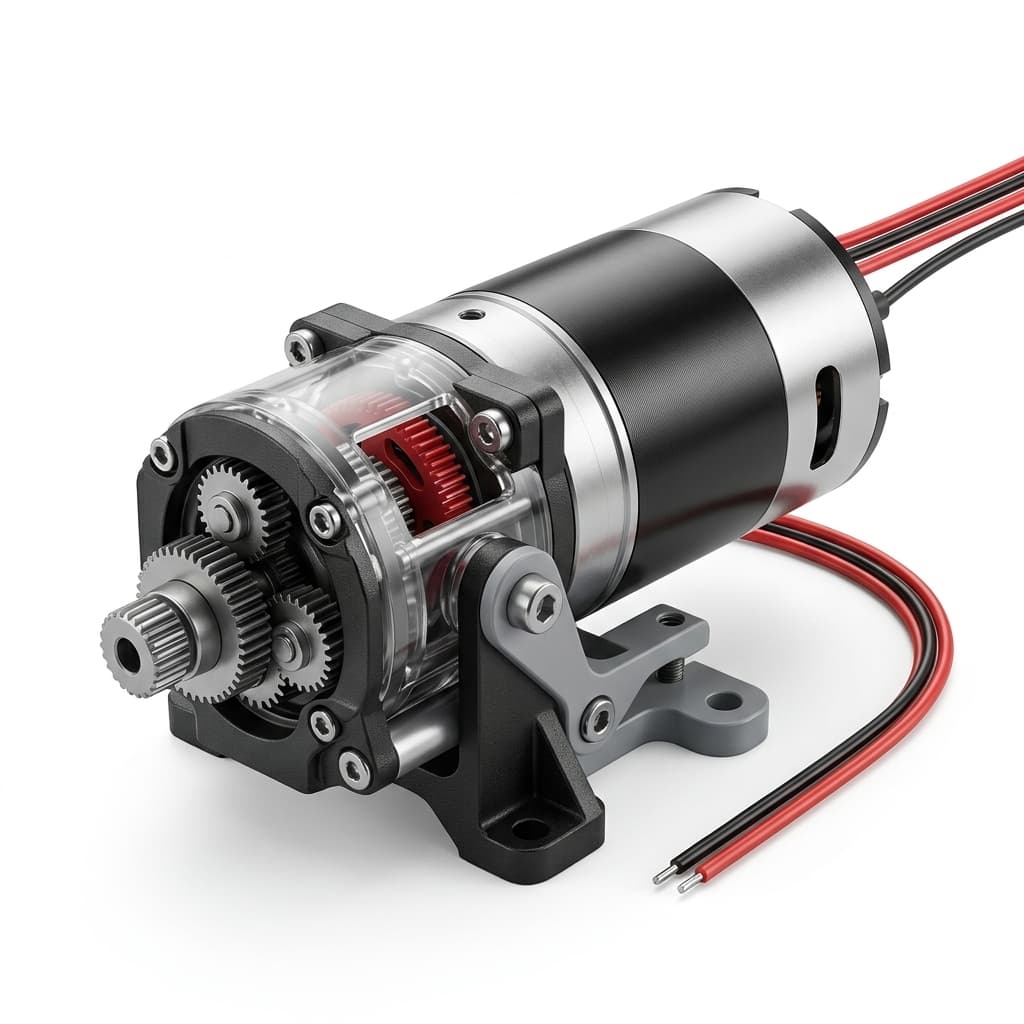
Product image for external packaging reference only. It does not establish frame size, internal carrier construction, bearing arrangement, or shock capability.
Define where a stop reaction enters the chassis. Supporting an external load close to its own bearings can reduce overhung loading on the gearmotor shaft. A compliant element needs enough travel before a secondary rigid stop engages. Verify torsional stiffness and damping from the actual coupling specification; an Oldham coupling is not automatically an impact absorber.
Check shaft flats, keyways, retaining features, and shoulder transitions against the transmitted load and available fatigue evidence. Splines or larger bearings are options to evaluate, not automatic fracture prevention. Review radial and axial shaft-load requirements alongside torsion.
Request CAD and interface drawings to confirm shaft support, mounting space, and any proposed clutch envelope. Treat access to internal construction details and availability of customization as supplier-confirmed RFQ items.
9. A 16-Point Sizing and Procurement Checklist
Use this checklist to turn a general “shock resistant” request into a reviewable specification. An unanswered item stays open; a calculation cannot substitute for missing rating conditions.
Operating profile
- Stop definition: distinguish intentional travel contact, accidental jams, emergency braking, and external reverse loading.
- Collision speed: record the highest credible motor and output speeds, including supply and control tolerances.
- Stopping behavior: provide measured or assumed duration, travel, compliance, and rebound; identify uncertainty.
- Lifetime events: separate routine impacts from rare emergency events, with frequency and temperature range.
Energy and torque budget
- Inertias: obtain rotor, input gear, intermediate stage, coupling, and external load inertia with units and reference axes.
- Reduction and control: document the exact ratio, running efficiency, current limit, and drive or braking state during impact.
- Energy path: identify what stores, dissipates, or returns energy, including a supply's capacity to absorb regeneration.
- Screen and peak: calculate the average screen, then obtain measured or validated modeled peak torque with adequate bandwidth.
Assembly strength
- Rating conditions: obtain continuous and transient torque limits, allowed duration, cycle count, direction, and derating conditions.
- Gear calculation scope: have a qualified designer identify applicable ISO 6336 methods and justify exclusions or alternative methods.
- Pin and carrier checks: evaluate unequal sharing, shear, bending, bore pressure, retention, and carrier deformation.
- Other load paths: check ring support, output shaft, bearings, housing, and mountings under combined loading.
Mitigation and acceptance
- Torque limiter: agree its minimum and maximum transmitted torque, energy capacity, wear allowance, and reset behavior if used.
- Controller evidence: record measured current response and braking mode rather than relying only on a claimed response time.
- Representative test: agree fixture stiffness, collision energy, actual load inertia, speed, instrumentation, and number of samples.
- Post-test limits: define backlash growth, noise, retained torque, shaft runout, inspection method, and acceptable functional behavior.
10. Frequently Asked Questions
Why can gears strip even when the driver limits current?
A current limit controls motor electromagnetic torque. The rotor and load may still be moving when contact occurs, and their energy must go somewhere. Response delay can add further load, but even immediate current removal does not eliminate inertia. Inspect synchronized torque, speed, and current traces before deciding whether the limitation is control timing, compliance, rating, or component strength.
Does a higher reduction ratio always increase shock risk?
The comparison must state what stays constant. At the same rotor speed and stopping time, ideal rotor reaction referred to the output scales with ratio. At the same output speed, rotor speed also rises with ratio and rotor energy grows with its square, if rotor inertia is unchanged. Real gearheads differ in stage construction, stiffness, efficiency, and ratings, so compare complete assemblies rather than ratio alone.
How does stall torque differ from intermittent peak torque?
Motor stall torque is an electrical operating point whose value depends on supply, temperature, and current regulation. Gearhead intermittent torque is a manufacturer's permitted mechanical load under stated conditions. Neither is a universal shock-energy rating. Request the duration and lifetime cycle allowance explicitly, and do not assume all products permit one-second peaks or a common percentage overload. Sustained stall also needs thermal protection.
Will a coreless motor always reduce impact energy?
Choose using actual rotor inertia and operating speed. A coreless brushed motor can have low inertia, but “brushless” describes commutation and includes several rotor constructions. A slotted BLDC motor does not necessarily contain a rotating iron armature equivalent to a brushed motor. Compare 0.5 × J × ω² for the specific candidates; no universal percentage reduction follows from the labels. See the coreless and brushless motor comparison for the broader selection questions.
How should an OEM specify slip clutch torque?
Specify a measured breakaway band and dynamic transmitted-torque limit over temperature, wear, speed, and event energy. The lowest setting must still meet the process load; the highest measured transient, including overshoot, must respect the weakest protected assembly limit. There is no universal 1.8-times-continuous setting. If those requirements overlap poorly, change the load profile or hardware rather than narrowing an unsupported nominal tolerance.
Does an ISO 6336 calculation prove emergency-stop survival?
No. Its applicable gear-rating methods do not automatically qualify carrier pins, bearings, shafts, plastic deformation, or the assembled actuator. Use the relevant calculations within their stated scope and agree a separate overload assessment and test plan. If permanent deformation is unacceptable, make that an explicit acceptance requirement. Do not cite a universal mandatory static factor without the applicable method, material data, and engineering agreement.
11. Sources, Standards, and Evidence Boundaries
- ISO — ISO 6336-1:2019: rating principles and influence factors. Public catalogue scope supports the method's applicability limits, including assembly-performance and manufacturing exclusions; it is not an impact certification.
- ISO — ISO 6336-3:2019: tooth bending calculations. Public scope identifies the tooth-bending subject and warns that it does not cover every failure mode. Minimum safety margins require an applicable method and engineering justification.
- ISO — ISO 6336-6:2019: variable-load service life. Public scope concerns pitting and tooth root bending under variable loading, rather than complete assembly shock qualification.
Evidence boundary, November 12, 2026: the linked catalogue descriptions support scope statements, not clause-level certification or material strength values. Numerical examples derive from the explicitly stated rigid-body assumptions and SI conversions. They are reproducible analytical scenarios, not physical test records, supplier guarantees, or standards-prescribed safety factors. Final approval requires the applicable full standard, responsible engineering review, and model-specific evidence.
Technical Support and Next Steps
For a sourcing discussion, send the completed checklist with your mounting envelope, expected volumes, and required evidence. Contact the application team to discuss the load profile and whether a standard or custom configuration can be evaluated. Request availability and test scope before relying on a clutch or reinforced carrier option.
Use the 12V high-torque planetary gear motor page to compare starting specifications, and request CAD and STEP files for packaging review. Product-family selection starts the assessment; the agreed transient envelope and acceptance test complete it.
Author

Categories
More Posts
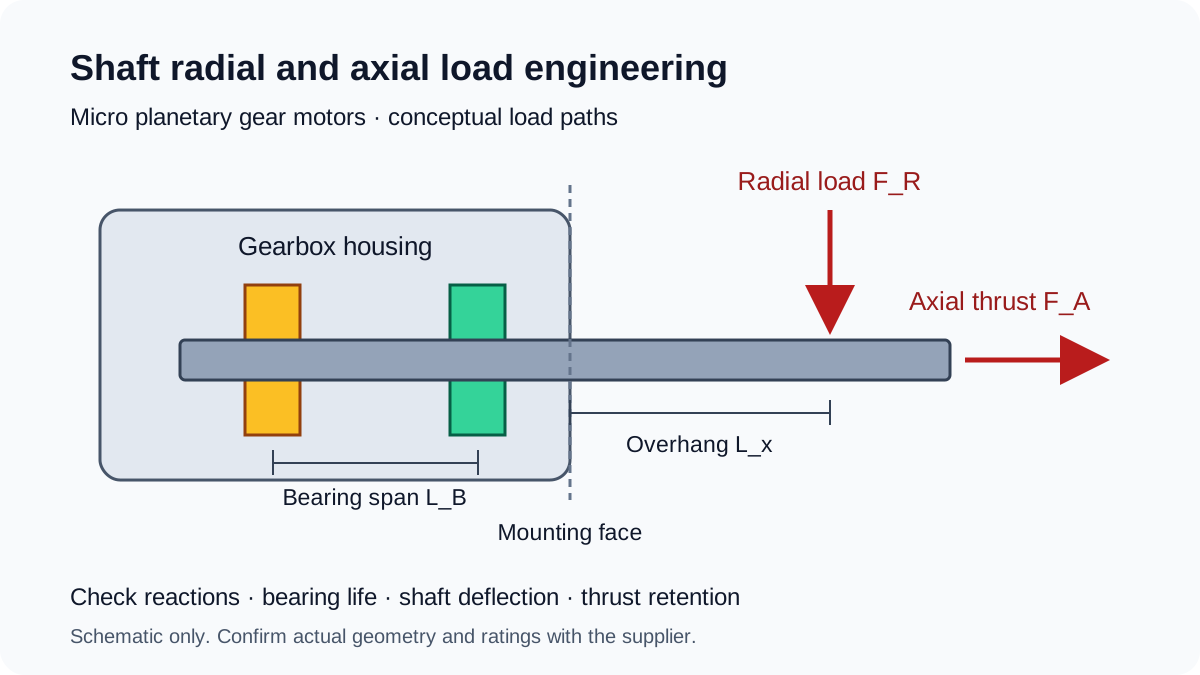
Shaft Radial and Axial Load Engineering in Micro Planetary Gear Motors: Overhung Sizing, Bushings vs. Dual Ball Bearings, and ISO 281 L10h Life
Size micro planetary gear motor shaft loads: calculate overhung reactions, compare bushings and ball bearings, and prepare an RFQ with ISO 281 L10h life inputs.
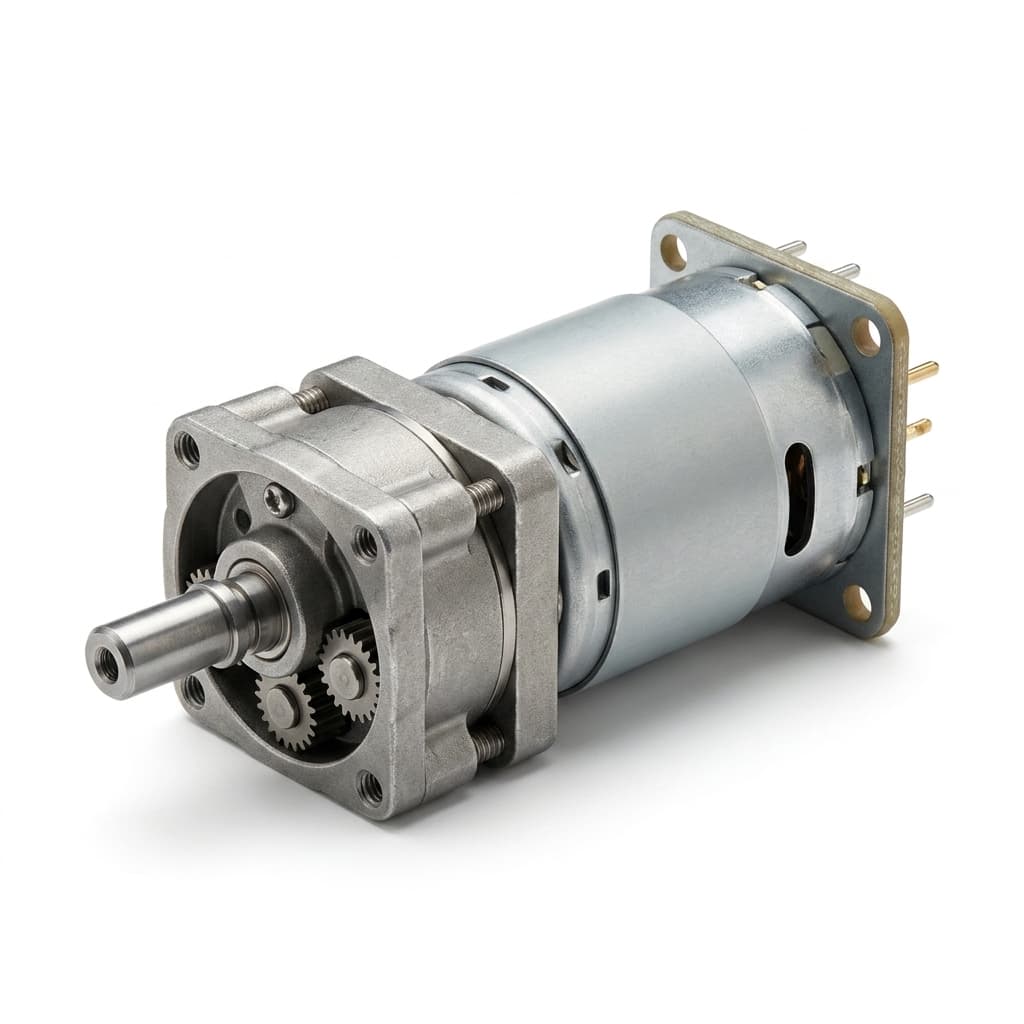
How to Calculate Planetary Gear Ratio and Output Torque
A practical engineering guide to calculating planetary gear reduction ratio, output speed, output torque, efficiency losses, stage count, and RFQ data for micro planetary gear motor projects.
How to Choose the Right Micro Planetary Gear Motor for Your Application
A comprehensive buyer-side engineering guide on sizing, torque requirements, gear materials, and selecting the optimal micro planetary gear motor architecture.